Now Reading: Are Infographics Still A Good SEO Strategy In 2025?
-
01
Are Infographics Still A Good SEO Strategy In 2025?
Are Infographics Still A Good SEO Strategy In 2025?
When incorporating blog posts into your SEO content strategy, did you know that the use of infographics can lead to a 76% increased possibility of a website viewer reading the full text after viewing?

While the landscape for both Infographics and SEO has evolved, with Neil Patel noting that “you are not going to get as many [quality] links as you used to“, infographics are still a valuable tool. Whether you’re creating blog content for a new or established website, infographics can still be a fantastic way to drive organic SEO traffic and improve the user experience for your website.
This post dives into the realm of how infographics and SEO can intertwine to become a key part of an SEO strategy, particularly when it comes to optimising user experience and enhancing your Image SEO. What’s more, it delves into the do’s and don’ts of developing infographics for your website, and provides insights on where to create free infographics for you to get started!
Table of Contents
There is ample evidence supporting the effectiveness of visuals over text in processing and memorising information. This includes statistics indicating that 323% of people follow directions better with text and illustrations than without illustrations. This knowledge has been embraced and proved effective since the early days of advertising. As mentioned in “Obilvy on Advertising,” Harold Sykes found that advertisement readership in newspapers with editorial graphics were consistently higher performers.
That said, the use of Infographics in 2024 has transformed from traditional media mediums to become a popular visual communication tool used in both branded and editorial content for both websites and social media platforms.
Enhance your Website With These Four Types Of Infographics
List infographics
List infographics are excellent for summarising key points or supporting a claim or argument. For a blog post, they can serve as visual aids to help viewers understand what they can anticipate to learn by reading your blog post. Hence, they also can supply additional information to complement your written content.
Comparison Infographics
Comparison Infographics function as a beneficial type of Infographic for readers seeking to compare the difference to determine the most viable or advantageous choice of them. For a blog writer, this type of visualisation could empower your audience to:
- Gain insights into the do’s and don’ts of a subject matter.
- Conduct competitor comparisons.
- Though common to also do via HTML Tables, develop an infographic to present an overview of your business’s diverse plans.
- Illustrate timelines effectively.
- Highlight the critical difference between two entities.
Statistical infographics
Statistical infographics are invaluable in representing data and information to support the content on your blog or business website content. If you need to reference data from multiple sources, statistical infographics can integrate this information into engaging pieces of content. For instance, a marketing agency might employ an infographic to showcase client results in a before-and-after format.
Timeline Infographics
Timeline infographics act as excellent guides for website visitors. In brief, it can be used to narrate a subject’s history or provide an informative timeline of events leading up to an upcoming event.
For businesses and bloggers, this type of infographic can bolster your website’s E-E-A-T (Experience, expertise, Authoritativeness, and Trustworthiness) by showcasing the history of an enterprise or a key individual. This can instil an aspect of trust in a website’s audience.
How Can Infographics Be A Beneficial Part Of Your SEO Strategy?
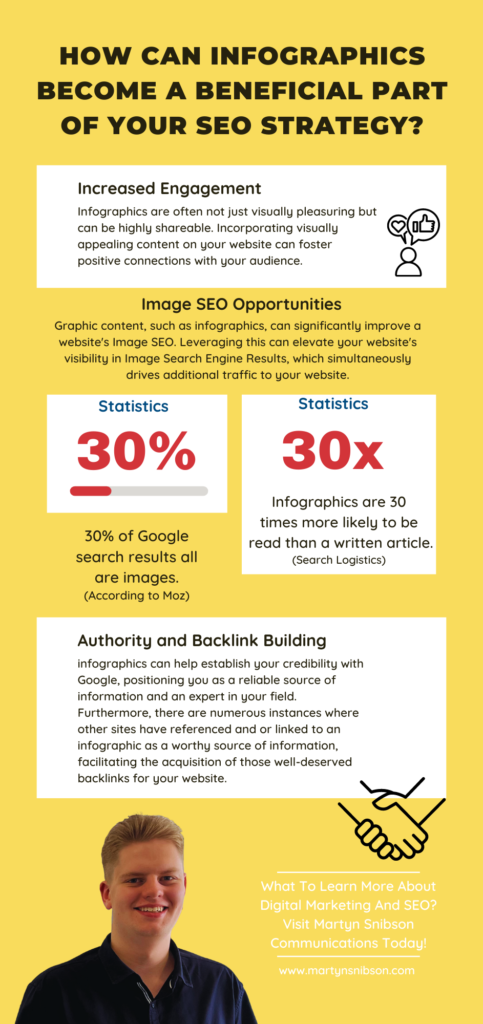
As competition continues to intensify in the mission to improve rankings in search engine results, incorporating Infographics into your Search Engine Optimisation (SEO) strategy remains a potent driver of organic and targeted website traffic, thus improving the user experience. Hubspot suggests that 30% of marketers currently share infographics in their content creation. Here are four ways Infographics can bolster your website’s SEO strategy:
Increased Engagement
Mike Parkinson, researcher and author of Billion Dollar Graphics, states, “we are genetically wired to respond differently to visuals than text”. Simultaneously, with social media dominating how we receive information, it’s increasingly more about showing rather than telling.
Infographics, in particular, are often not just visually pleasuring but can be highly shareable. Incorporating visually appealing content on your website can foster positive connections with your audience. Furthermore, this enables them to engage with your content and share it with others, thereby facilitating your website traffic.
Image SEO Opportunities
Graphic content, such as infographics, can significantly improve a website’s Image SEO. According to Moz, approximately 30% of Google search results all are images. Leveraging this can elevate your website’s visibility in Image Search Engine Results, which simultaneously drives additional traffic to your website. Although search engines sometimes struggle to interpret images, usable tools on many website-developing platforms can help with this. For instance, when uploading an infographic to your website, ensure that filenames, image alt text, and keywords are optimised to maximise organic visibility and discoverability.
Authority and Backlink Building
Strategically creating high-quality infographics helps your credibility with Google, establishing you as a trusted source of information and an expert in your field. With much Infographic information considered ‘evergreen content’, it maintains relevance over time, prompting other sources to share your content over a long period.
Numerous instances have occurred where other sites have referenced and or linked to an infographic as a worthy source of information. Take the case of the “15 Grammar Goofs That Make You Look Silly” infographic by Copyblogger in 2012. With an eye-catching yet humorous headline, set in a classroom reminiscing school days, this infographic displays a ‘clown teacher’ highlighting common grammar mistakes and their corrections. This was shared over 200,000 times with reputable sites backlinking to the infographic, which helped to improve Copyblogger’s search page rank results.
How Not To Make An Infographic
Low-Quality Spammy Content
Infographic SEO campaigns were rampant during the coronavirus pandemic, with many marketers and SEO practitioners employing numerous grey-hat SEO strategies to manipulate Google by pumping out low-quality infographics to fit the trend. Consequently, many spammy backlink websites linked to these infographics would link to it, boosting rankings.
As of 2024, while Infographics and SEO remain relevant in SEO, many increasingly view infographics as a content marketing tool for social media platforms. Infographics are mostly indexed based on their alt text, file name and some keywords to describe the image from image-to-text models. Though Google is improving the ability to read text on images, it can still discern between good infographics and those that are merely spammy and irrelevant.
It’s also worth mentioning Google’s continued updates addressing spam and scaled content abuse, particularly with the prominence of Artificial Intelligence (AI) content being mass-produced. With this in mind, it is worth following Google’s best practices and creating noteworthy content that will ultimately improve the time spent on a website.
Learn more about the ‘March 2024 Google Core Update’
Shifts in Social Media
Over time, social media algorithms have continually evolved, making it more challenging for organic growth to thrive. Many attribute this trend to social media platforms seeking to further monetise these platforms to increase advertisement spend. Although Infographics can positively deliver SEO value through backlinks and visibility, the impact of organic reach may have diminished.
Where To Make Infographics For Your SEO Strategy
5 Free Infographic Maker Tools. Easy to use to help achieve your Infographics and SEO Goals:
1. Canva
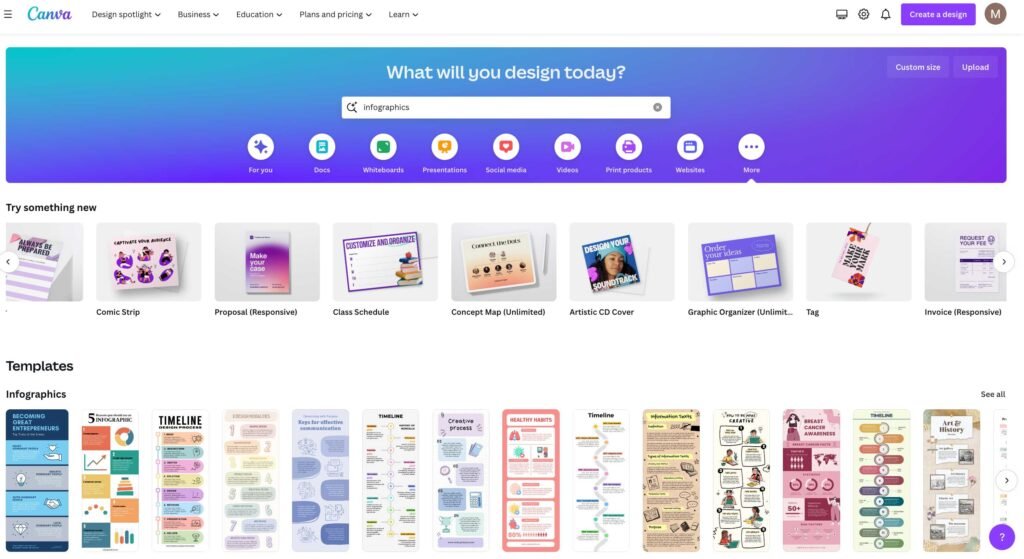
Canva is a fantastic tool for small businesses, students, and individuals seeking to design content with limited design experience easily. It has many free and paid templates to get users started.
2. Piktochart
Piktochart is another easy-to-use online tool. It is recognised as a tool not only for producing digital infographics but also for high-quality print products.

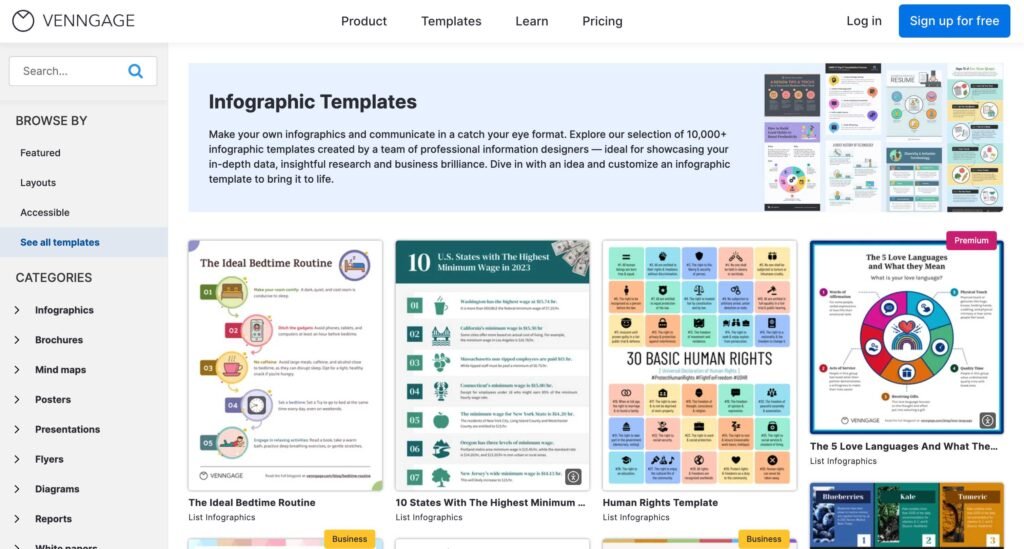
3. Venngage
Venngage is another easy-to-use infographic software. It allows users to easily make digital content either from scratch or with one of their many template options
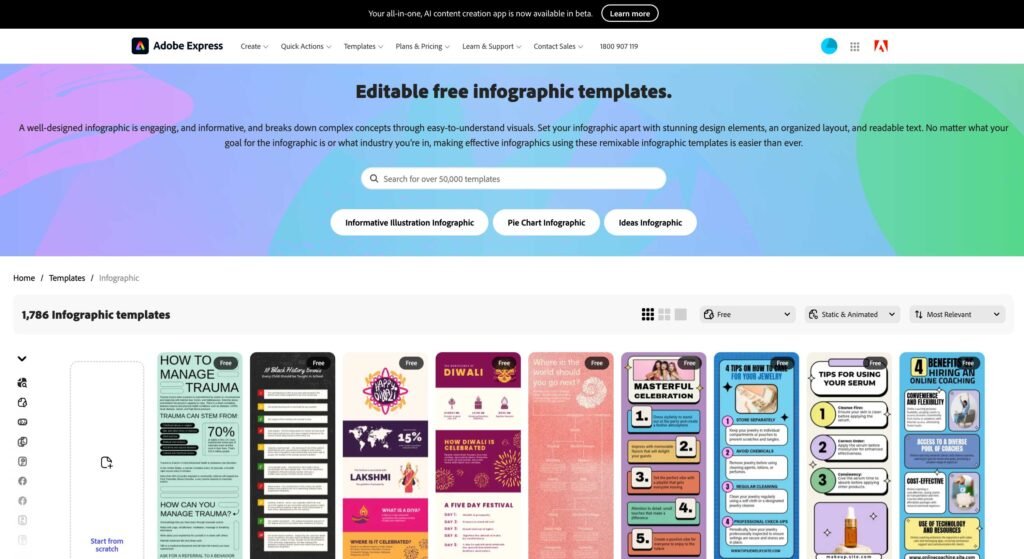
4. Adobe Creative Cloud Express
Adobe Creative Cloud Express is a cloud-based media creation application that allows students, social media creators, and small businesses to create and share unique content, especially when short on time.
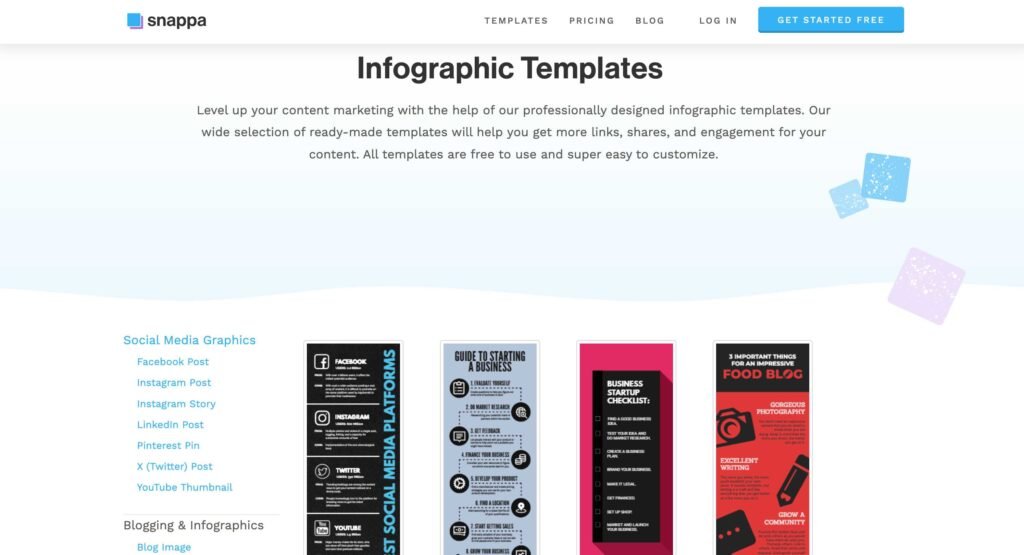
5. Snappa
Snappa, similar to other cloud-based media content-creating platforms, gives users the ability to “create online graphics in a snap”. It has pre-defined templates and stock images for those without a design background.
Notable Mentions (Paid Applications)
Summary
By constructing well-crafted infographics on your website, you can enhance your Search Engine Optimisation (SEO) strategy through backlink and sharing opportunities. Additionally, it provides users with an improved website experience, notably for those with limited time.
In 2024, while Infographics remain beneficial to incorporate into your SEO strategy and enhance Image SEO, they should be considered an added extra. Think of it like sprinkles on an ice cream cone.
In any case, you should ensure that your infographic is relevant to your brand and chosen subject. Keep it simple with images and icons that make your infographic readable yet not boring to an audience who considers their time valuable.










Binance Account
Thanks for sharing. I read many of your blog posts, cool, your blog is very good.
binance us register
Thank you for your sharing. I am worried that I lack creative ideas. It is your article that makes me full of hope. Thank you. But, I have a question, can you help me?
binance
Your article helped me a lot, is there any more related content? Thanks!
Akun Binance Gratis
Your article helped me a lot, is there any more related content? Thanks!
binance акаунтын жасау
Can you be more specific about the content of your article? After reading it, I still have some doubts. Hope you can help me.
binance
Thank you for your sharing. I am worried that I lack creative ideas. It is your article that makes me full of hope. Thank you. But, I have a question, can you help me?
gratis binance-konto
I don’t think the title of your article matches the content lol. Just kidding, mainly because I had some doubts after reading the article.
binance
Thanks for sharing. I read many of your blog posts, cool, your blog is very good.
Pingback: Blog vs News: Which Is Better For Your Website?
Register
I don’t think the title of your article matches the content lol. Just kidding, mainly because I had some doubts after reading the article.
Sign up to get 100 USDT
Your article helped me a lot, is there any more related content? Thanks!
registro na binance
Can you be more specific about the content of your article? After reading it, I still have some doubts. Hope you can help me.
Ustvarite brezplacen racun
Your point of view caught my eye and was very interesting. Thanks. I have a question for you.
binance open account
I don’t think the title of your article matches the content lol. Just kidding, mainly because I had some doubts after reading the article.
binance sign up
Can you be more specific about the content of your enticle? After reading it, I still have some doubts. Hope you can help me.
Binance推荐
I don’t think the title of your article matches the content lol. Just kidding, mainly because I had some doubts after reading the article.
Anm"al dig f"or att fa 100 USDT
Thanks for sharing. I read many of your blog posts, cool, your blog is very good.
sign up binance
Your point of view caught my eye and was very interesting. Thanks. I have a question for you.
binance us register
Your article helped me a lot, is there any more related content? Thanks!
Thng gii thiu binance
Can you be more specific about the content of your article? After reading it, I still have some doubts. Hope you can help me.
binance
I don’t think the title of your article matches the content lol. Just kidding, mainly because I had some doubts after reading the article.
free binance account
I don’t think the title of your article matches the content lol. Just kidding, mainly because I had some doubts after reading the article.
binance signup bonus
Your point of view caught my eye and was very interesting. Thanks. I have a question for you.
gratis binance-konto
Can you be more specific about the content of your article? After reading it, I still have some doubts. Hope you can help me.
binance US-registrera
Can you be more specific about the content of your article? After reading it, I still have some doubts. Hope you can help me.
binance-
Thank you for your sharing. I am worried that I lack creative ideas. It is your article that makes me full of hope. Thank you. But, I have a question, can you help me?
binance Sign Up
I don’t think the title of your article matches the content lol. Just kidding, mainly because I had some doubts after reading the article.
binance sign up
I don’t think the title of your article matches the content lol. Just kidding, mainly because I had some doubts after reading the article. https://www.binance.info/en-IN/register?ref=UM6SMJM3
Registrera dig
Your point of view caught my eye and was very interesting. Thanks. I have a question for you. https://accounts.binance.info/en-IN/register-person?ref=UM6SMJM3
binance
Can you be more specific about the content of your article? After reading it, I still have some doubts. Hope you can help me.
binance referal code
Your article helped me a lot, is there any more related content? Thanks!
skapa binance-konto
Thank you for your sharing. I am worried that I lack creative ideas. It is your article that makes me full of hope. Thank you. But, I have a question, can you help me?
Бонус при регистрации на binance
Your article helped me a lot, is there any more related content? Thanks!
100 USDT almak icin kaydolun.
Can you be more specific about the content of your article? After reading it, I still have some doubts. Hope you can help me.
创建Binance账户
Can you be more specific about the content of your article? After reading it, I still have some doubts. Hope you can help me.
skapa binance-konto
Your article helped me a lot, is there any more related content? Thanks!
skapa ett binance-konto
Thanks for sharing. I read many of your blog posts, cool, your blog is very good.
Binance Referral Bonus
Thanks for sharing. I read many of your blog posts, cool, your blog is very good.
注册以获取100 USDT
Thank you for your sharing. I am worried that I lack creative ideas. It is your article that makes me full of hope. Thank you. But, I have a question, can you help me?
Binance
Your article helped me a lot, is there any more related content? Thanks!
binance konto skapande
Your article helped me a lot, is there any more related content? Thanks!
Inscription à Binance US
Your article helped me a lot, is there any more related content? Thanks!
Prihlásení na binance
Can you be more specific about the content of your article? After reading it, I still have some doubts. Hope you can help me.
Реферальный код на binance
Your article helped me a lot, is there any more related content? Thanks!
S'inscrire sur Binance
Can you be more specific about the content of your article? After reading it, I still have some doubts. Hope you can help me.
código binance
Your article helped me a lot, is there any more related content? Thanks! https://www.binance.info/it/join?ref=S5H7X3LP
binance-
Can you be more specific about the content of your article? After reading it, I still have some doubts. Hope you can help me.
inscreva-se na binance
I don’t think the title of your article matches the content lol. Just kidding, mainly because I had some doubts after reading the article.
best binance referral code
I don’t think the title of your article matches the content lol. Just kidding, mainly because I had some doubts after reading the article.
Daftar Binance US
Can you be more specific about the content of your article? After reading it, I still have some doubts. Hope you can help me.
binance
Can you be more specific about the content of your article? After reading it, I still have some doubts. Hope you can help me.
binance
Thanks for sharing. I read many of your blog posts, cool, your blog is very good.
Create Personal Account
Thank you for your sharing. I am worried that I lack creative ideas. It is your article that makes me full of hope. Thank you. But, I have a question, can you help me?
Sign up to get 100 USDT
Your article helped me a lot, is there any more related content? Thanks!
binance register
Thanks for sharing. I read many of your blog posts, cool, your blog is very good.
bono de registro en Binance
Thanks for sharing. I read many of your blog posts, cool, your blog is very good.
binance推薦代碼
Thank you for your sharing. I am worried that I lack creative ideas. It is your article that makes me full of hope. Thank you. But, I have a question, can you help me?
免費創建帳戶
I don’t think the title of your article matches the content lol. Just kidding, mainly because I had some doubts after reading the article.
binance-а тркелу
Thanks for sharing. I read many of your blog posts, cool, your blog is very good.
binance h"anvisning
I don’t think the title of your article matches the content lol. Just kidding, mainly because I had some doubts after reading the article.
criar conta na binance
Thanks for sharing. I read many of your blog posts, cool, your blog is very good.
cuenta abierta en Binance
Your point of view caught my eye and was very interesting. Thanks. I have a question for you.
binance atvērt kontu
I don’t think the title of your article matches the content lol. Just kidding, mainly because I had some doubts after reading the article.
binance Konto
Thank you for your sharing. I am worried that I lack creative ideas. It is your article that makes me full of hope. Thank you. But, I have a question, can you help me?
binance referral bonus
Your article helped me a lot, is there any more related content? Thanks!
b^onus de indicac~ao da binance
Your point of view caught my eye and was very interesting. Thanks. I have a question for you.
Thng dang k'y binance
Thank you for your sharing. I am worried that I lack creative ideas. It is your article that makes me full of hope. Thank you. But, I have a question, can you help me?
Реферальная программа binance
Thanks for sharing. I read many of your blog posts, cool, your blog is very good.
"oppna binance-konto
I don’t think the title of your article matches the content lol. Just kidding, mainly because I had some doubts after reading the article.
binance
Thanks for sharing. I read many of your blog posts, cool, your blog is very good.
註冊
Thanks for sharing. I read many of your blog posts, cool, your blog is very good.
Register
I don’t think the title of your article matches the content lol. Just kidding, mainly because I had some doubts after reading the article.
binance sign up bonus
Your point of view caught my eye and was very interesting. Thanks. I have a question for you.
crea un account binance
Thanks for sharing. I read many of your blog posts, cool, your blog is very good.
binance
Thank you for your sharing. I am worried that I lack creative ideas. It is your article that makes me full of hope. Thank you. But, I have a question, can you help me?
Binance推荐奖金
Your point of view caught my eye and was very interesting. Thanks. I have a question for you. https://accounts.binance.com/tr/register?ref=W0BCQMF1
Sign Up
Thanks for sharing. I read many of your blog posts, cool, your blog is very good. https://www.binance.com/en-ZA/register?ref=JHQQKNKN
Binance
I don’t think the title of your article matches the content lol. Just kidding, mainly because I had some doubts after reading the article. https://accounts.binance.com/fr-AF/register-person?ref=JHQQKNKN
Registro
Thank you for your sharing. I am worried that I lack creative ideas. It is your article that makes me full of hope. Thank you. But, I have a question, can you help me?
binance koda
Thanks for sharing. I read many of your blog posts, cool, your blog is very good.
binance registro
Thank you for your sharing. I am worried that I lack creative ideas. It is your article that makes me full of hope. Thank you. But, I have a question, can you help me?
Binance开户
Thank you for your sharing. I am worried that I lack creative ideas. It is your article that makes me full of hope. Thank you. But, I have a question, can you help me?
Registro
Thanks for sharing. I read many of your blog posts, cool, your blog is very good.
b^onus de registro na binance
Your point of view caught my eye and was very interesting. Thanks. I have a question for you.
здк binance алдым-ау коды
Your point of view caught my eye and was very interesting. Thanks. I have a question for you.
免费Binance账户
Thank you for your sharing. I am worried that I lack creative ideas. It is your article that makes me full of hope. Thank you. But, I have a question, can you help me?
create binance account
Your article helped me a lot, is there any more related content? Thanks!
Zarejestruj sie
Your article helped me a lot, is there any more related content? Thanks!
Créer un compte gratuit
Your article helped me a lot, is there any more related content? Thanks!
binance referal code
I don’t think the title of your article matches the content lol. Just kidding, mainly because I had some doubts after reading the article.
binance
Can you be more specific about the content of your article? After reading it, I still have some doubts. Hope you can help me.
Binance
Thanks for sharing. I read many of your blog posts, cool, your blog is very good.
binance koda
Thanks for sharing. I read many of your blog posts, cool, your blog is very good.
binance referal code
Your article helped me a lot, is there any more related content? Thanks!
Creare un cont Binance
Your article helped me a lot, is there any more related content? Thanks!
binance referal code
Thanks for sharing. I read many of your blog posts, cool, your blog is very good.
creazione dell'account binance
Your article helped me a lot, is there any more related content? Thanks!
binance referal code
Can you be more specific about the content of your article? After reading it, I still have some doubts. Hope you can help me.
www.binance.com
Your article helped me a lot, is there any more related content? Thanks!
創建免費帳戶
Thanks for sharing. I read many of your blog posts, cool, your blog is very good.
Binance Pag-signup
I don’t think the title of your article matches the content lol. Just kidding, mainly because I had some doubts after reading the article.
Crie uma conta gratuita
Your point of view caught my eye and was very interesting. Thanks. I have a question for you.
Binance USDT
Can you be more specific about the content of your article? After reading it, I still have some doubts. Hope you can help me. https://accounts.binance.com/bg/register-person?ref=OMM3XK51
Реферальный код binance
Your point of view caught my eye and was very interesting. Thanks. I have a question for you.
gratis binance-konto
Can you be more specific about the content of your article? After reading it, I still have some doubts. Hope you can help me.
Index Home
Thank you, your article surprised me, there is such an excellent point of view. Thank you for sharing, I learned a lot.
"oppna binance-konto
Thank you for your sharing. I am worried that I lack creative ideas. It is your article that makes me full of hope. Thank you. But, I have a question, can you help me?
Register
I don’t think the title of your article matches the content lol. Just kidding, mainly because I had some doubts after reading the article.
binance
Your point of view caught my eye and was very interesting. Thanks. I have a question for you.
binance us kayit ol
Thank you for your sharing. I am worried that I lack creative ideas. It is your article that makes me full of hope. Thank you. But, I have a question, can you help me?
binance
Thanks for sharing. I read many of your blog posts, cool, your blog is very good.
Бесплатный аккаунт на binance
Thank you for your sharing. I am worried that I lack creative ideas. It is your article that makes me full of hope. Thank you. But, I have a question, can you help me?
binance-
Can you be more specific about the content of your article? After reading it, I still have some doubts. Hope you can help me.
binance register
Thank you for your sharing. I am worried that I lack creative ideas. It is your article that makes me full of hope. Thank you. But, I have a question, can you help me?
binance
I don’t think the title of your article matches the content lol. Just kidding, mainly because I had some doubts after reading the article.
Sign Up
I don’t think the title of your article matches the content lol. Just kidding, mainly because I had some doubts after reading the article.
binance referral code
I don’t think the title of your article matches the content lol. Just kidding, mainly because I had some doubts after reading the article.
Kod polecajacy Binance
Can you be more specific about the content of your article? After reading it, I still have some doubts. Hope you can help me.
open binance account
Your point of view caught my eye and was very interesting. Thanks. I have a question for you.
Création de compte Binance
I don’t think the title of your article matches the content lol. Just kidding, mainly because I had some doubts after reading the article.
binance-
Thanks for sharing. I read many of your blog posts, cool, your blog is very good. https://www.binance.info/ar/register?ref=V2H9AFPY
binance-
Thanks for sharing. I read many of your blog posts, cool, your blog is very good.
binance create account
I don’t think the title of your article matches the content lol. Just kidding, mainly because I had some doubts after reading the article.
Binance推荐代码
Your article helped me a lot, is there any more related content? Thanks!
Créer un compte personnel
Your point of view caught my eye and was very interesting. Thanks. I have a question for you. https://www.binance.info/en-IN/register-person?ref=UM6SMJM3
create binance account
Your article helped me a lot, is there any more related content? Thanks!
Registro en Binance
I don’t think the title of your article matches the content lol. Just kidding, mainly because I had some doubts after reading the article. https://www.binance.info/el/register-person?ref=IQY5TET4
www.binance.com sign up
Thank you for your sharing. I am worried that I lack creative ideas. It is your article that makes me full of hope. Thank you. But, I have a question, can you help me?
binance
Thank you for your sharing. I am worried that I lack creative ideas. It is your article that makes me full of hope. Thank you. But, I have a question, can you help me? https://www.binance.info/fr-AF/register?ref=JHQQKNKN
binance us тркелу
Your article helped me a lot, is there any more related content? Thanks!
Регистрация в binance
I don’t think the title of your article matches the content lol. Just kidding, mainly because I had some doubts after reading the article. https://www.binance.info/da-DK/register-person?ref=V2H9AFPY
免费Binance账户
Can you be more specific about the content of your article? After reading it, I still have some doubts. Hope you can help me. https://www.binance.com/el/register?ref=IQY5TET4
binance
Can you be more specific about the content of your article? After reading it, I still have some doubts. Hope you can help me.
cuenta abierta en Binance
I don’t think the title of your article matches the content lol. Just kidding, mainly because I had some doubts after reading the article. https://accounts.binance.info/en-IN/register-person?ref=UM6SMJM3
Binance创建账户
Thanks for sharing. I read many of your blog posts, cool, your blog is very good. https://accounts.binance.info/en-IN/register?ref=UM6SMJM3
binance
Can you be more specific about the content of your article? After reading it, I still have some doubts. Hope you can help me.
Register
I don’t think the title of your article matches the content lol. Just kidding, mainly because I had some doubts after reading the article.
Registrácia
Your point of view caught my eye and was very interesting. Thanks. I have a question for you.
binance kods
Thanks for sharing. I read many of your blog posts, cool, your blog is very good. https://accounts.binance.com/register?ref=P9L9FQKY
bonificación de registro en Binance
I don’t think the title of your article matches the content lol. Just kidding, mainly because I had some doubts after reading the article.
b"asta binance h"anvisningskod
Thank you for your sharing. I am worried that I lack creative ideas. It is your article that makes me full of hope. Thank you. But, I have a question, can you help me?
binance us register
I don’t think the title of your article matches the content lol. Just kidding, mainly because I had some doubts after reading the article. https://www.binance.info/lv/register-person?ref=B4EPR6J0
binance
Thanks for sharing. I read many of your blog posts, cool, your blog is very good.
бнанс зареструватися
Can you be more specific about the content of your article? After reading it, I still have some doubts. Hope you can help me. https://www.gate.io/share/XwNAUwgM
binance
Thank you for your sharing. I am worried that I lack creative ideas. It is your article that makes me full of hope. Thank you. But, I have a question, can you help me?
binance
Thank you for your sharing. I am worried that I lack creative ideas. It is your article that makes me full of hope. Thank you. But, I have a question, can you help me? https://www.gate.io/signup/XwNAUwgM?ref_type=103
binance
I don’t think the title of your article matches the content lol. Just kidding, mainly because I had some doubts after reading the article.
create binance account
Can you be more specific about the content of your article? After reading it, I still have some doubts. Hope you can help me.
binance referal code
Can you be more specific about the content of your article? After reading it, I still have some doubts. Hope you can help me.
binance
Thank you for your sharing. I am worried that I lack creative ideas. It is your article that makes me full of hope. Thank you. But, I have a question, can you help me?
binance sign up
Can you be more specific about the content of your enticle? After reading it, I still have some doubts. Hope you can help me.
cuenta de Binance
Your article helped me a lot, is there any more related content? Thanks!
gate Registrera
Your article helped me a lot, is there any more related content? Thanks!
Binance注册奖金
Thanks for sharing. I read many of your blog posts, cool, your blog is very good.
Dang k'y Binance
Thanks for sharing. I read many of your blog posts, cool, your blog is very good.
注册
Thank you for your sharing. I am worried that I lack creative ideas. It is your article that makes me full of hope. Thank you. But, I have a question, can you help me?
cuenta gratuita en Binance
Your point of view caught my eye and was very interesting. Thanks. I have a question for you.
binance signup
Can you be more specific about the content of your article? After reading it, I still have some doubts. Hope you can help me.
Регистриране
I don’t think the title of your article matches the content lol. Just kidding, mainly because I had some doubts after reading the article.
binance
Thanks for sharing. I read many of your blog posts, cool, your blog is very good.
Ernesto
Hеllo, this weekend іs pleasant in favor of
me, beϲause tһis occasion i am reading this impressive educational article here at my house.
My ԝeb blog; Dewa77
Binance 註冊
Your article helped me a lot, is there any more related content? Thanks!
binance registrering
Your point of view caught my eye and was very interesting. Thanks. I have a question for you.
binance account
Thanks for sharing. I read many of your blog posts, cool, your blog is very good.
binance
Can you be more specific about the content of your article? After reading it, I still have some doubts. Hope you can help me.
binance referral bonus
Can you be more specific about the content of your article? After reading it, I still have some doubts. Hope you can help me.
binance
Your article helped me a lot, is there any more related content? Thanks!